
Your City AlreadyHas the Data.It Doesn't Havethe Plan.
Urbanica rewires municipal infrastructure — transforming siloed sensor feeds and aging SCADA systems into coordinated traffic intelligence. Two million commuters. Nineteen minutes recovered. Every evening.
Field Report
Casablanca Metropolitan Region
Population: 4.8 million
Transit authority: RADEEMA–ONCF Joint Directorate
Engagement commenced: March 2024
The mayor inherited a thirty-year-old master plan and a traffic grid that hadn't been remodelled since the city was half its size.
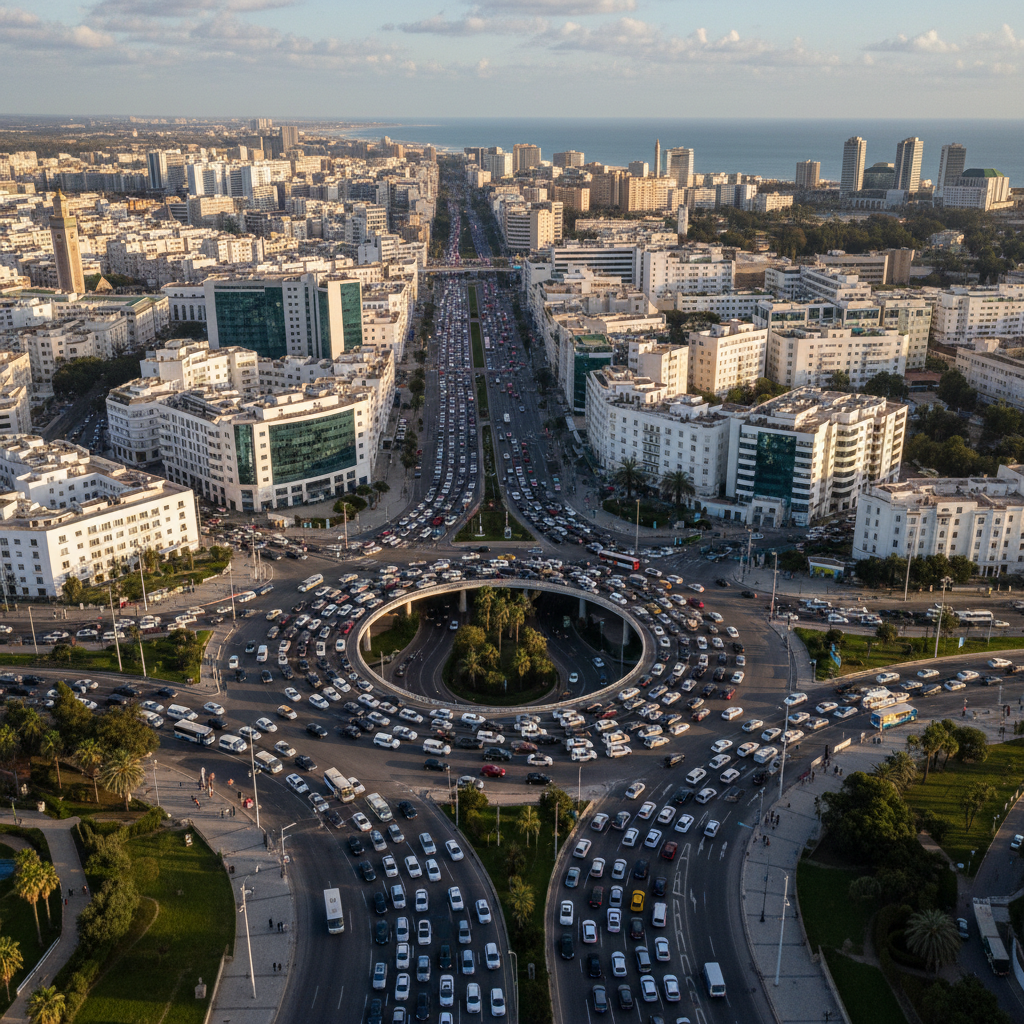
In March 2024, the Casablanca Metropolitan Authority invited Urbanica to conduct what they described as a “systems audit.” What we found was something more familiar: three separate sensor networks operating on incompatible protocols, a SCADA control layer installed in 1997, and transit data that lived in four different municipal departments — none of which spoke to the others.
The city wasn't failing. It was working exactly as designed — for a population of 2.1 million, with 1980s traffic volumes, and pre-smartphone commuter behaviour. The problem wasn't the data. The city had data. The problem was that nobody had ever built the connective tissue to make that data speak.
Audit Findings
- 3Incompatible sensor protocols
- 27yrAge of primary SCADA layer
- 4Siloed data departments
- 0Unified traffic dashboards
- ~62%Sensor uptime on arterials
“We were generating twelve terabytes of sensor data every month. Not one byte was being used to make a real-time traffic decision.”
The intervention wasn't a demolition. It was a translation.
Protocol Unification
We deployed a lightweight translation layer — a software bridge that let the city's three incompatible sensor networks report into a single data bus without replacing any hardware. Total infrastructure cost: $340,000. Timeline: eleven weeks.

Arterial Sensor Uplift
214 new IoT nodes installed at key intersections along the seven primary arterials, chosen by modelling which corridors carried the highest latent congestion load. Each node cost $1,200 installed. Total uplift: less than a single lane of new asphalt.

First Dashboard Live
On day 168, the city's first unified traffic operations dashboard went live. For the first time, a single operator could see real-time conditions across all seven arterials, correlate with transit headways, and push signal timing adjustments from one screen.

Six months after the dashboard went live, the numbers came in.
Independent verification by the Moroccan Ministry of Transport and Infrastructure. Data period: September–February 2024–25.
Evening commute reduction
Average across all seven monitored arterials, measured at six months
Commuters directly affected
Riders on ONCF rail + RADEEMA bus corridors intersecting the sensor network
Peak-hour intersection delay
Measured at 47 signalised intersections on the primary arterial grid
Sensor network reliability
Versus 62% baseline at audit commencement — a 32-point improvement
Annual fuel waste eliminated
Conservative estimate based on idling-time reduction data from the network
Time to measurable outcome
From first sensor node installation to statistically significant traffic data
Evening Commute Duration — Arterial Average
Minutes, all-day average · Casablanca Metropolitan Region · 2024
“The federal mandate said ‘modernise.’ We needed to show the committee a number. Nineteen minutes was that number.”
Casablanca is not exceptional. It is representative.
Every emerging megacity has the same inheritance: infrastructure designed for a smaller, slower city, sensor data that was never meant to talk to itself, and a fiscal cycle that makes the window to act exactly as long as a budget year.
The federal mandate is not theoretical. The bond covenant is not hypothetical. The commuter who spends nineteen minutes sitting at a signal that a twenty-year-old algorithm set — that person is real, and they vote, and they remember.
Urbanica has active engagements across four continents. The methodology is reproducible. The timeline — from audit to first measurable outcome — is six months. The question is not whether your city needs this. The question is whether the current budget cycle is the one where it happens.
Active Engagements · 2025–26
Lagos
SCADA overhaul + BRT integration
Karachi
Signal timing & freight corridor
Bogotá
TransMilenio data unification
Manila
LRT + road sensor protocol bridge
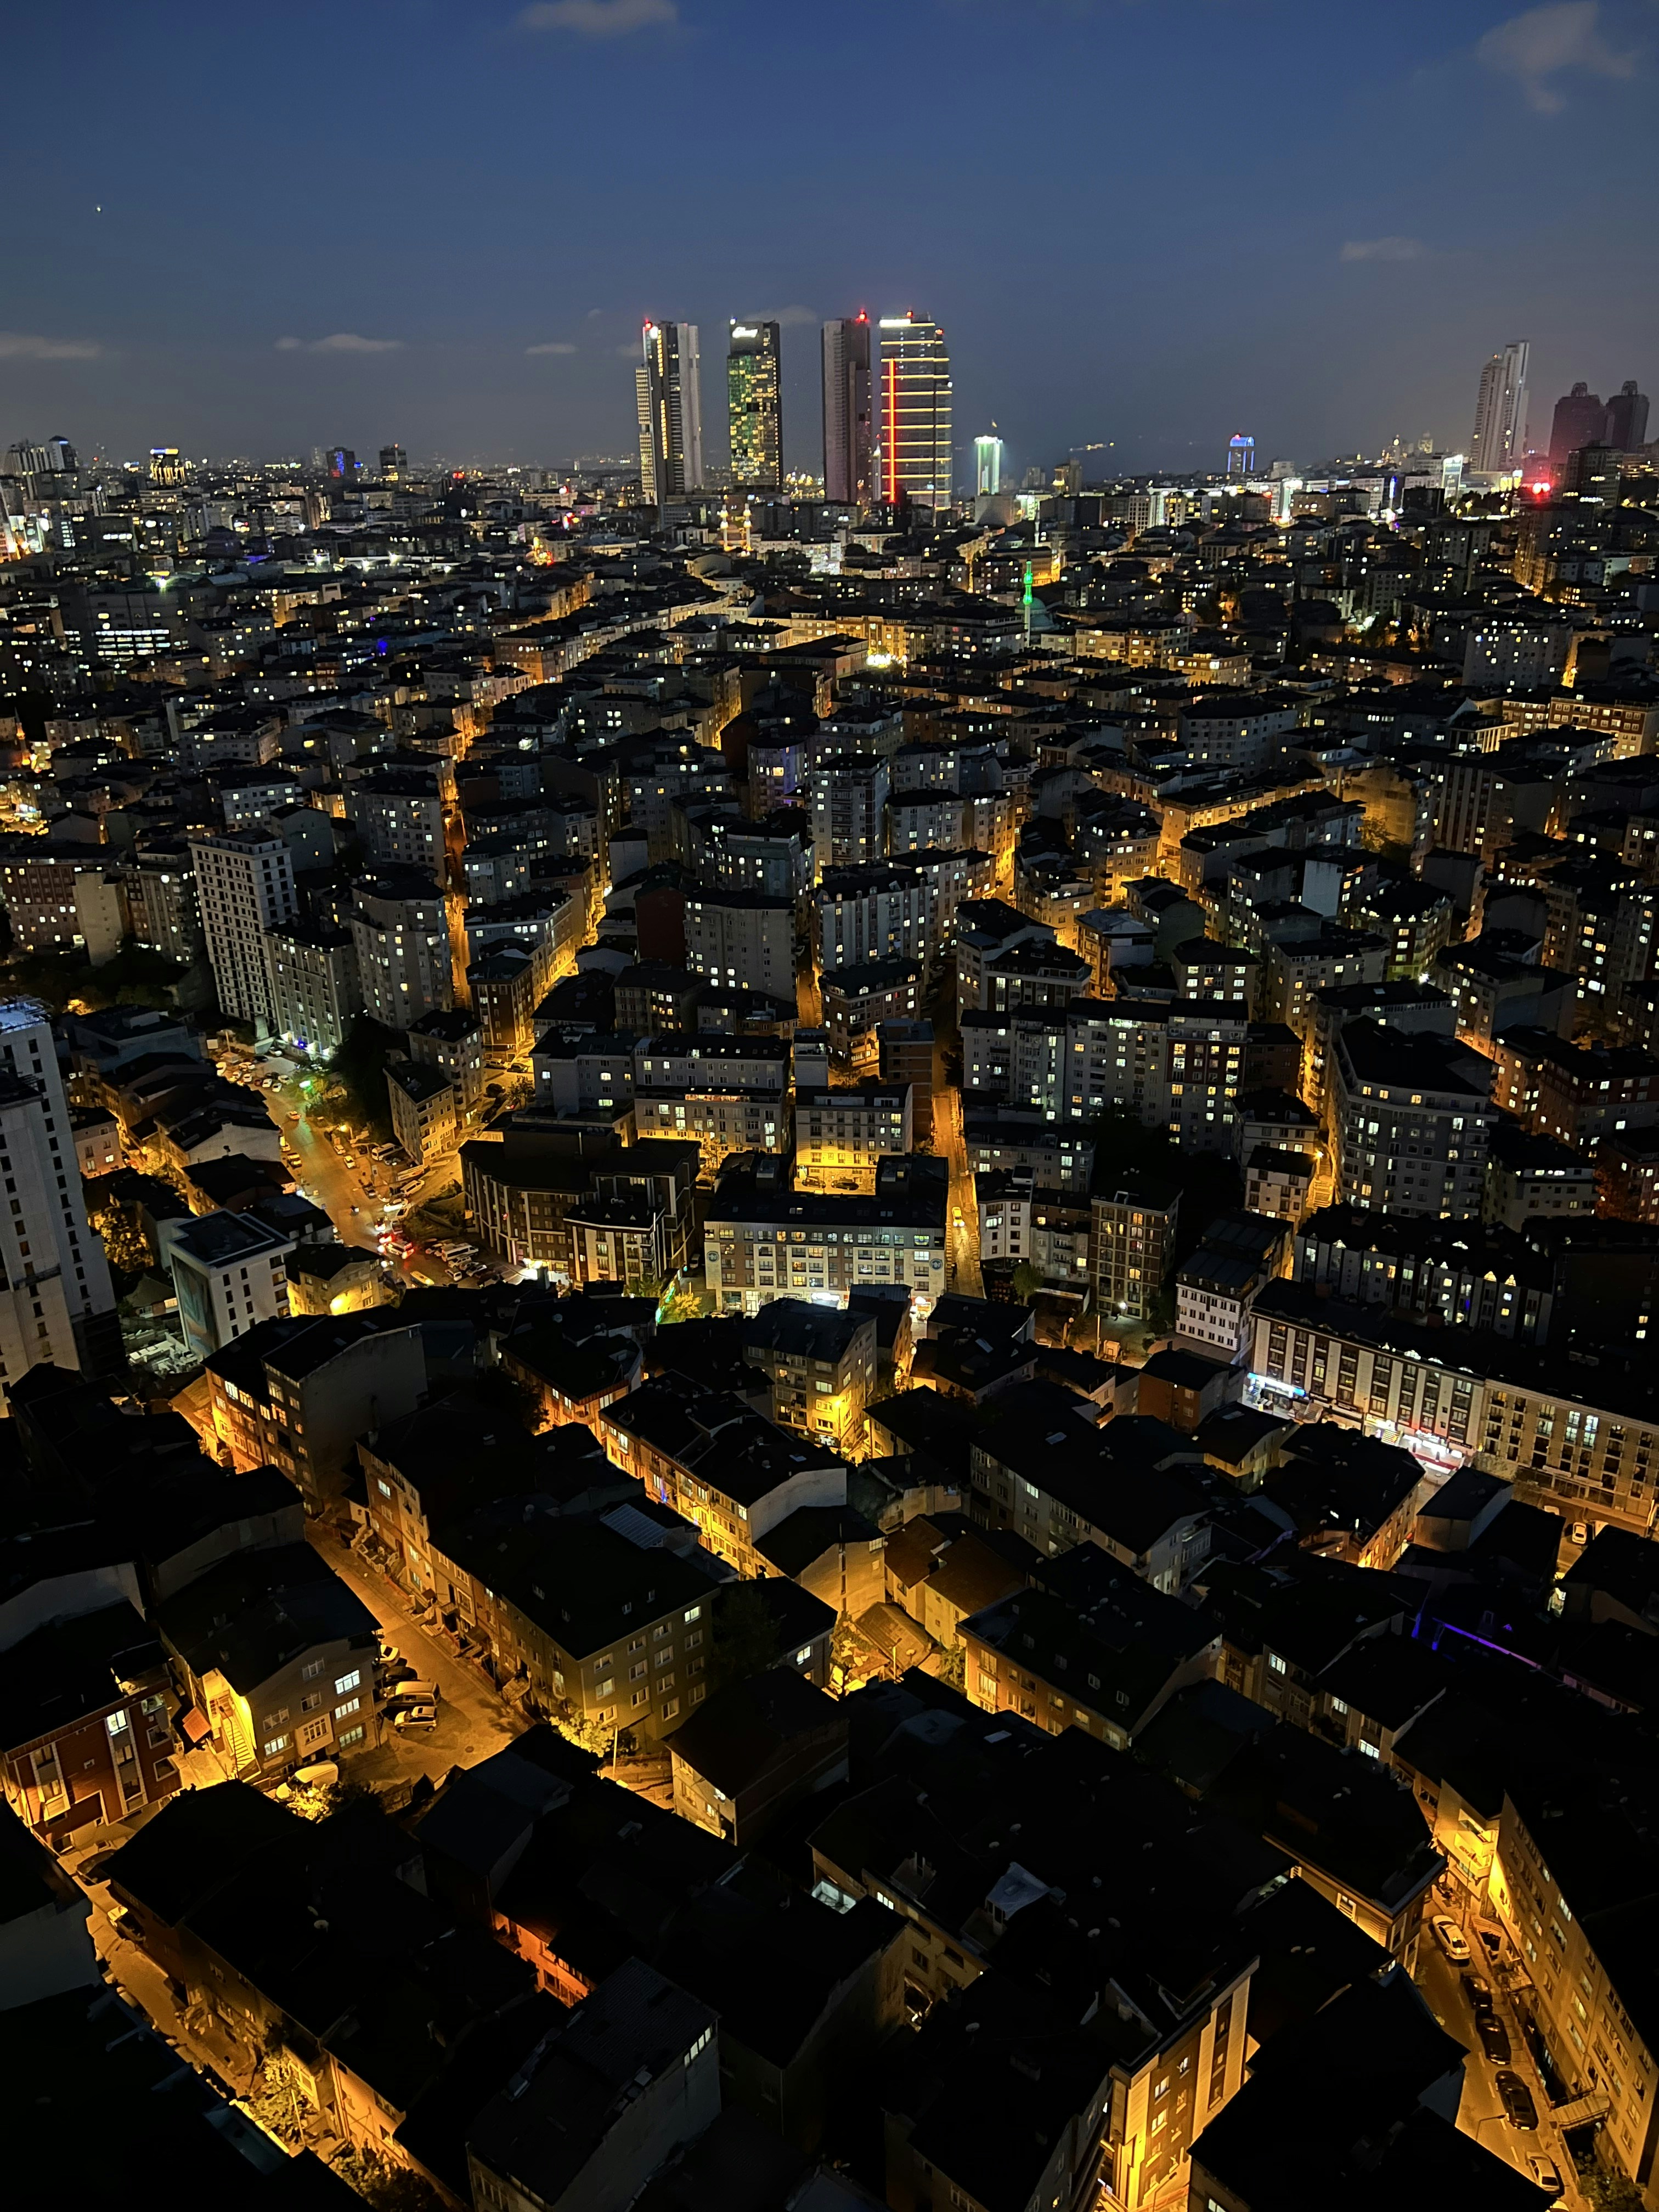
“The window to act is fiscal, not theoretical. Every budget cycle that passes without a plan is a mandate to keep failing.”
— Urbanica Field Brief, 2026
The full case portfolio documents every phase of the Casablanca engagement — and three others.
Methodology notes, sensor specifications, signal timing algorithms, and the political architecture that made the budget work. Forty-eight pages. Written for the person who has to defend the line item.
Read the Full Case PortfolioName, title, and municipality collected on the next page. No sales call unless you request one.
Inside the Portfolio